I present to you the results of my research:
Geographical information system (GIS) beginnings date back to the 1960’s. (Shekar and Xiong 2007 p 3) and it is constantly developing since that period. GIS actually presents the digital tool for graphical and analytical presentation of real spacious phenomenon and manipulation with numerous spacious data for making of spacious analysis and methods. (Heywoodisar, 2006, p7). In order to enable real spacious phenomena to be processed, they must be presented in a form which computer can use. Firstly, the pieces of information we need to solve some problem must be defined and obtained, then it is necessary to decide how to organize and analyze necessary pieces of information to get wanted results. This process is called data modeling (Wise, 2002, p 5).
In essence, GIS use two basic databases: vector and raster data, and as a third value, which describes certain phenomena, is used attributive data. (Roić i Cetil 2002, p 2). Vector type of data shows phenomena in nature by using basic geometrical shapes: point, line, and polygons. Raster is the simple form of data which contains matrix cells organized in rows and columns. By using this matrix, actually, we present the space.
GIS technology has found its application in numerous practical and scientific disciplines. There are numerous examples of using GIS technology in forestry, when mapping and seclusion of forest management units, making of a digital base to use different GPS applications and similar. Example of using GIS technology to monitor the health condition of the forests can be found in the ICP’s report for the forest in Serbia 2004-2005. for level one.
Norway spruce is one of the most important species of forestry in our country. But due to the effect of different biotic and abiotic factors, often the stability of forest ecosystems where the Norway spruce grows, is reduced. One of the most important biotic factors are bark beetles and the most important species are the European spruce bark beetle (Ips typographus) and six dentated bark beetle (Pityogenes chalcographus).
Bark beetles are a relatively large group of insects with over 2000 species registered throughout the world. In Bosnia and Hercegovina, 44 species of bark beetles are registered, but only 20 species live on the most economically significant conifers (Mešić i sar. 201, p 4). The significant characteristic of bark beetles is their tendency to gradation when they are capable to dry out several thousand hectares of coniferous forest. Because of that, it is necessary to develop the suitable system to follow the number of caught beetles and to predict potential places where will gradation occur, in order to implement appropriate protection measures to prevent further spreading of gradation.
In this work will be elaborated methodology of using modern techonology such as GIS in prognosis of potential cores for development of bark beetles gradation. Worked out methodology is the combination of traditional methods of controlling bark beetles number (setting up pheromonic traps) and modern tools for spacious analysis of data in GIS software, in order to obtain wanted results. When we obtain wanted data about potential cores for gradation development it is necessary to implement appropriate protection measures.
Firstly, setting up of additional hunting trees and pheromonic traps should be done, in order to prevent further development of gradation. Advantage of data obtained by this way is because they create clear graphical view (map) of potentially critical zones. From created maps or from software it is possible to read and determine coordinates at which it is necessary to place hunting trees or additional pheromonic traps in order to achieve a maximum positive effect.
The main goal of this work is the development of the methodology of GIS technology use, as one comprehensive and very useful software for visualization and analysis of spacious data, in the prognosis of bark beetles gradation development. Since QGIS very simple and software that is available to everyone, in this work is explained its use possibilities in the field of forestry.
Main task of this work is to provide insight in critical zones (zones under high intensity bark beetles attack) and make their spacious analysis, to analyze distribution of critical zones by elevation and exposure and to determinate effect of these factors to gradation, in order to obtain results that can be used for forming multicriteria and HP analysis.
Materials and methods
Research area for the purposes of this work is teritory of forest economically area „Bosansko-Petrovčko“ which is managed by subsidiary “Šumarija” (PŠ) Bosanski Petrovac (picture 1) under the auspices of foresty company “Unsko-Sanske šume”.

The total area of the forest that is managed by the PŠ „Šumarija“ Bosanski Petrovac is 70967,53 hectares. Forest management area „Bosansko-Petrovačko“ is located in the field of interior Dinaric Alps. The climate of this area is moderate continental climate and modified continental climate. According to the data from the current forest management plan average annual temperature of the air is 7,85 °C and its value during the vegetation period is 14,07 °C. The height of annual atmospheric precipitate is 1219 mm. Calcareous and dolomites are the type of substrate rocks that prevails in the area. The types of soils that have been products of these substrate types: calcomelanosol, calcocambisol, luvisols at the calcareous substrate, and in some cases redzines on the calcareous substrate, distric cambiosols. Forest soils are shallow, dry and skeletal.
In the forest management area Bosansko-Petrovačkom the most common forest management units are 1205 (High mixed forest of beech, Norway spruce and Silver fir on deep soils on calcareous and/or silicates substrates), 4501 (Other coppice forests), 4106 (Secondary beech and beech with other broadleaves coppice forests on the deep calcareous and/or dolomite soils) and 1104 (Secondary high beech forests mostly on deep calcareous soils and/or dolomites) (Picture 2.) From the aspect of this work, biggest importance has the forest management unit 1205 with the total area of 17130 ha.
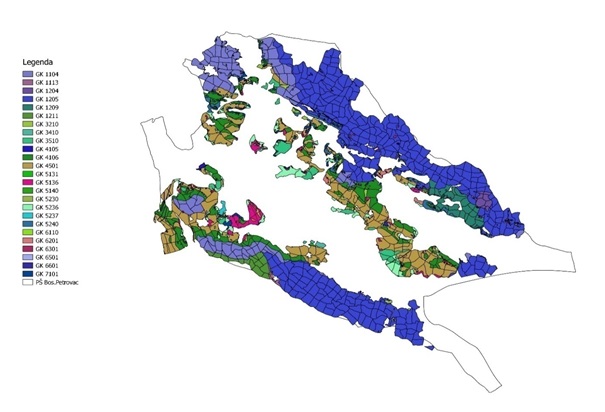
Picture 2. Forest management units in ŠPP „Bosansko-Petrovačkom“
After the basic data from the current forest management plan have been collected, it was necessary to collect information about the coordinates and number of installed pheromones traps on the territory of Bosansko-Petrovačko forest management area. For each trap, data about the coordinates and number of caught bark beetles on the annual basin, have been collected.
Most of the information about the number of caught bark beetles on the annual basin per trap was taken over from the Forest company Bosanski Petrovac, from the engineers that work on the forest protection and silviculture on the territory of this forest management area. Their job is to make the journal about the number of caught beetles on the annual basin in the pheromone traps. Some of traps coordinates were missing, so the fieldwork for this work was to find these traps and collect their coordinates. Coordinates from 170 traps were collected and analyzed. Traps that have been placed afterward and traps nearby sawmills haven’t been analyzed.
After all necessary data were collected, they were analyzed in software Microsoft Exel 2016. The database was made in this software in such way that each trap has the ordinal number, X and Y coordinate and number of caught bark beetles on the annual basis. This kind of database was converted from standard Excel Workbook in CSV (Comma delimited) format and it was inputted into the QGIS 2.18.5 with the “Add Delimited Text Layer” tool (Picture 3). QGIS is opensource software written in C++ programming language and working interface is provided by using KT TrollTech graphical library. Since QGIS is the opensource program source files of codes are free and they enable programmers worldwide to constantly develop its features. Development of this software is mainly done in the application program’s interface for programming language C++ and Python (Poizot i Mear 2009, p 515). Additional options in QGIS are enabled by different additional mechanisms (Plugins), which can be downloaded during the working session.
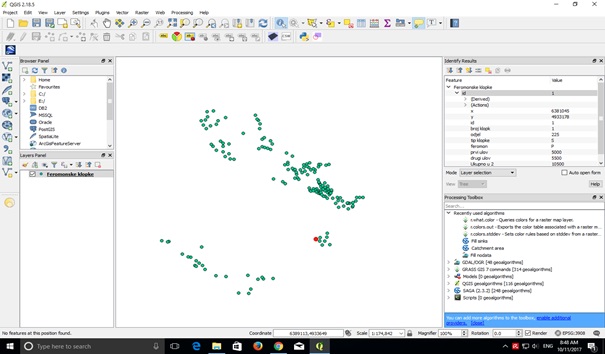
margPicture 3. Pheronomic traps inserted by using tool ““Add Delimited Text Layer”
After importing CSV files in working space of the QGIS software, the positions of every trap, that are located in the earlier formed database, can be located. Each trap still is attributed to the basic value (number of caught bark beetles). For the further analysis plugin „Interpolation“ was used. This plugin interpolates given data on the space of the forest economically area. Interpolation is done in a way that software analyzes values of surrounding points and mathematically fills the space between them. More precisely it gives value to every pixel of the picture. For the purposes, for this work, the method of interpolation that was used is the interpolation of linear distances (IDW). The result of this interpolation is obtained as raster files and the size of the raster cells are 20×20 meters.
To single out critical zones it is necessary to know critical values of bark beetles number. According to some literature sources Karadžić and others, (2011, p 329-330), traps for control of bark beetles number should be placed on every 5 hectares of forest. They are placed in two series and must be controlled every 7-10 days when the number of caught adult bark beetles are counted. At the end of the year and after all reviews, the numbers of caught adult bark beetles are summed. According to the same author’s intensity of the bark beetle attack are classified into the three categories (low, medium and high intensity) (Table 1).
| Low intensity | Less than1000 adult bark beetles per trap |
| Medium intensity | 1000 – 4000 adult bark beetles per trap |
| High intensity | More than 4000 adult bark beetles per trap |
Table 1: Prognosis of the attack intensity per pheronomic traps
These results are given for one generation. If we look the whole year than this results should be doubled. Based on this data, by tool „Raster calculator“ critical zones were separated (over 10000 adult bar beetles- high-intensity attack). This tool was used to analyze the prevalence of critical zones according to elevation and exposure. For this analysis was used tool Digital Elevation Model (DEM) with size 20x20m.
Results and discussion
From aspect of a number of caught bark beetles in forest economically area Bosansko Petrovačko, the most important are forest management units 1205 (Mixed beech, Norway spruce, and silver fir forests mainly on deep calcareous and dolomites soils).
Analysis of forest management unit 1205
Under high-intensity attack (critical zone) in forest management unit 1205, the total area of 13,309 ha or 77,69% of total surface of that class is located. (Picture 4)
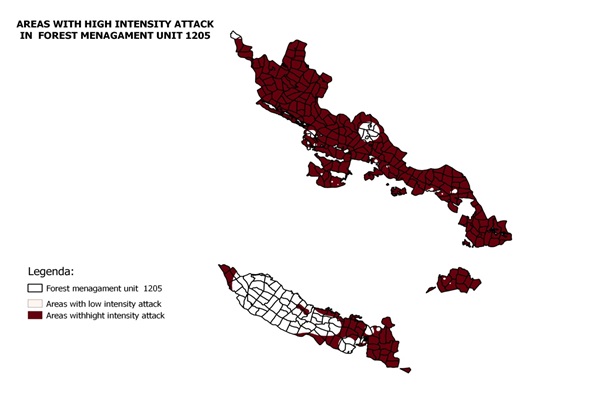
Picture 4. Critical zones of attack in forest management unit 1205
This high percentage of participation of critical zones points on the presence of high gradation, which is present in the culmination point. So the measures against bark beetles spreading must be intensified.
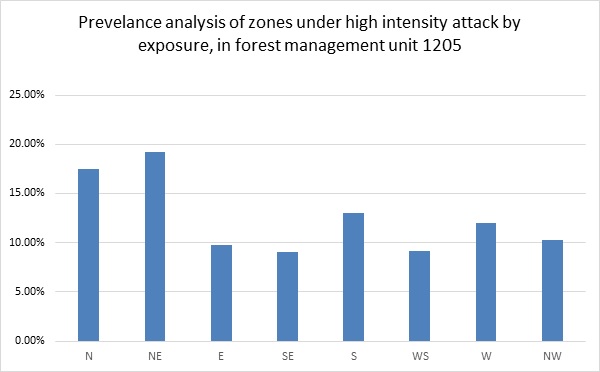
Prevalence analysis of zones under high-intensity attack by elevation in forest management unit 1205 shows that the most parts of critical zones are located at the altitudinal span from 1000-1200 ma.s.l. In this altitudinal span is located around 58,4% of total critical zones area. In the altitudinal span from 1200-1400 ma.s.l. is located 26,9% of total critical zones, while the area with the least surface of critical zones is located in the altitudinal span from 1400-1600 ma.s.l., with 223,593 ha or 1,7%. Remaining part of the zones with the high-intensity attack is located in the altitudinal span from 700-1000 ma.s.l.
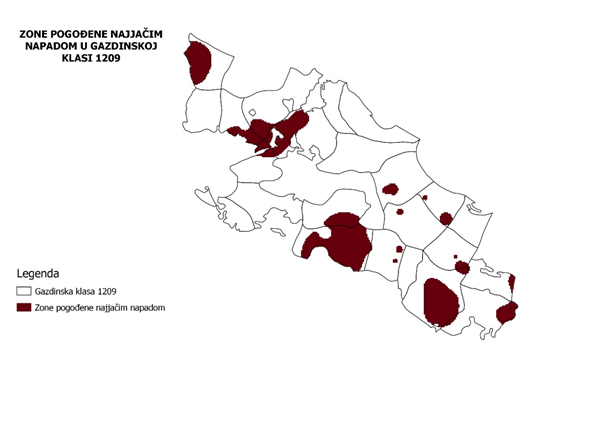
Prevalence analysis of zones under high-intensity attack, by exposure, in forest management unit 1205 shows that most part is located in: northeast and north exposure. Around 19% surface of critical zones are located at northeast exposure while around 17% of critical zones are located at north exposure. It is noticeable that on transitional exposures such are southeast and southwest, is located least areas with the high-intensity attack, with the total amount of 7%.
Zones that are most affected by bark beetles attack are located in the economic unit „Grmeč-Bosanski Petrovac“ in sections: 170, 171, 172, 174, 175, 176, 177, 178, 179, 178 and partially in sections 173 and 166. Other parts of the zones that are affected by the bark beetles attack are located in section 30, 40, 63 and partially in section 37, 41 (Picture 5).
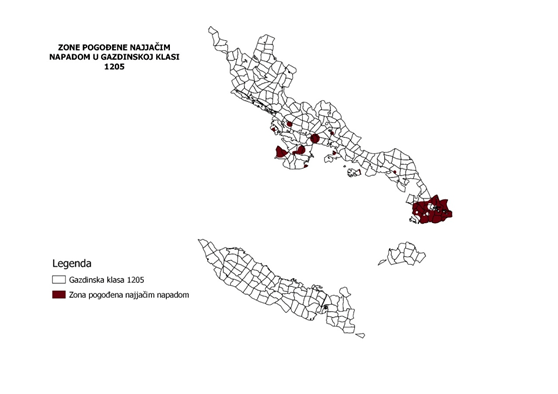
Picture 5. Most affected zones by bark beetles attack in forest management unit 1205
This intensity of the attack makes the survival in this sections of the Norway spruce questionable. During the fieldwork, numerous dried trees can be noticed, which represents suitable places for further development of gradation. In this section, it is necessary to intensify protection measures by placing additional economic traps. Placing of the hunting trees is not recommended in this case. It is necessary to cut down dried trees as soon as possible and to prevent long staying of those trees in forests complex.
Analysis of forest management unit 1209
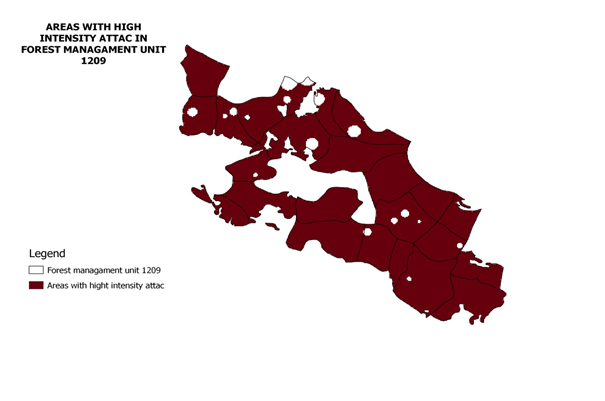
Under high-intensity attack (critical zones) is located 1.141,57 ha or 97,8% of total area of this forest management unit 1209. (Picture 6)
Picture 6. Most affected zones by bark beetles attack in forest management unit 1209
Prevalence analysis of zones under high-intensity attack (critical zones) by elevation in forest management unit 1209 shows that most parts of critical zones are located at the altitudinal span from 1000-12000 m a.s.l. 67,1 % of critical zones are located at this elevation. The least area of critical zones of forest management unit 1209 is located at the altitudinal span from 1200-1400 m a.s.l. with the participation of 9,2%. In the altitudinal span from 700-1000 m a.s.l. the total area of high intensity attacked zones is 250,26 ha.
Prevalence analysis of zones under high-intensity attack (critical zones) by exposure, in the forest management unit 1209 (Graph 1) shows that most parts of critical zones are located at west and southwest exposure. At the southwest, exposure is located 21% of total area of forest management unit 1209, while at the west exposure is located around 19% of critical zones areas. The smallest areas of critical zones are located at east exposure with the participation of 5,1%. It is noticeable that bigger representation of critical zones is located at warmer exposures. These results are partially matched with the results that were obtained by Mešić (2010) in his research work in this area. His conclusion after he analyzed a number of caught bark beetles in certain sections of the economic unit „Grmeč-Bosanski Petrovac“, is that the biggest number of caught bark beetles was on warm exposures, south, and southwest. But, in our case its hard to conclude how exposures influence appearance and development of migration because almost all area of forest management unit is under high-intensity attack. So this analysis by exposures actually shows orography of this forest management unit. But from mentioned research, it can be noticed that the most efficient traps are those that were placed at south exposures. This data can be used when placing pheromonic traps in order to fight developed gradation.
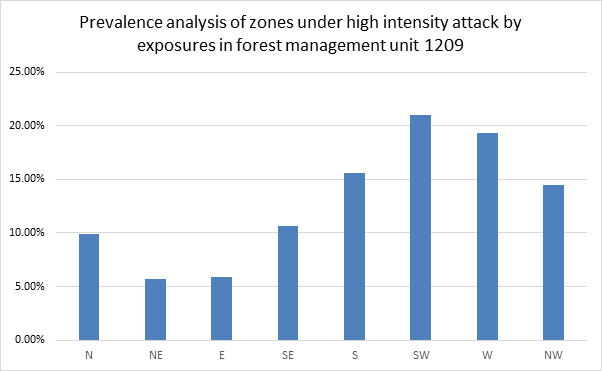
Graph 1: Prevalence analysis of zones under high-intensity attack by exposures in forest management unit 1209
Zones that are most affected by bark beetles attack in forest management unit 1209 are located in the economic unit „Grmeč-Bosanski Petrovac“. Most affected are the sections 134, 137, and 167. Partially are affected sections 127 and 113, while the smaller zones appear in sections 139, 140, 142, and 167 (Picture 6).
Picture 6. Zones affected by most intensive attack in forest management unit 1209
Conclusion
The mentioned methodology of using GIS technology enables visual representation of critical zones and potential zones for bark beetles gradation. This way of application and processing data may be used for continuous tracking and space analysis, of bark beetles movement on the level of the forest economically area.
Once recorded coordinates and established database can be continuously upgraded, from year to year, which enables annual tracking of a number of caught bark beetles and efficiency of certain combat measures. Also, it is possible to define accurate locations based on this method, in which combat measures must be intensified, nevermind if it’s placing of hunting trees or placing of pheromonic traps.
When the data were collected and analyzed in forest economical area „Bosansko-Petrovačko“ the high-intensity gradation of bark beetles attack have occurred. By this gradation, most affected are forest management unit 1205 and 1209.
In forest management area 1205 under high-intensity attack is located 77,69 % of total area of forest management unit 1205, while almost all area of forest management unit 1209 is affected by bark beetles attack.
Analysis of zones under high-intensity attack (critical zones) shows that the most participation of critical zones is located at altitudinal span 1000-1200 m a.s.l. This altitudinal span represents also an ecological optimum for the establishment of mixed beech and silver fir forests and mixed Norway spruce and silver fir forests. This data can be highly useful while defining factors that effect on the occurrence of bark beetles gradation and collecting of necessary information for multicriteria and HP analysis.
Analysis by exposure shows that that the most participation of critical zones is located at the colder north and northeast exposures in forest management unit 1205, while the most participation of critical zones in forest management unit 1209 is located at the warmer south and southwest exposures. It is hard to conclude what is the effect of exposure gradation occurrence because the most area of these forest management units is affected by bark beetles attack, so this analysis by exposure presents orographic characteristics of the terrain.
Literature
Shekar S., Xiong H. (2007): Encyclopedia of GIS, Springer Heywood, I., Cornelius, S., Carver, S. (2006): An Introduction to Geographical Information Systems. Prentice Hall. 3rd edition.
Wise S. (2002): GIS Basics, Taylor & Francis Routledge
Roić M., Cetl V. (2002): Transformacije geometrijskih podataka u katastru, Geodetski list, Zagreb
Mešić H., Dautbašić M., Mujezinović O. (2012): Upotreba feromonskih klopki u praćenju i suzbijanju smrčinog pisara (Ips typographus L.) na planini Grmeč, Naše šuume, broj 26-27, 3-10
Poizot E., Me´ar Y. (2009): Using a GIS to enhance grain size trend analysis, Environmental Modelling & Software 25, 513–525
Karadžić D., Mihajlović Lj., Milanović S., Stanivuković Z. (2011): Priručnik izvještajne i dijagnostičko prognozne službe zaštite šuma, Univerzitet u Banjoj Luci, Šumarski fakultet
Forest Condition Monitoring in the Republic of Serbia, Annual Report ICP Forest 2004, 2005, Level I, Beograd, December 2005
Priručnik za monitoring zdravstvenog stanja šuma i zaštite od potkornjaka (http://www.hbsume.ba/public/files/prirucnik_monitoring_zdravstvenog_stanja_suma.pdf)
The results were published in:
Stojanović M., Hadžić N. (2018): Science, Culture and Youth : Сборник трудов по материалам III Международной студенческой научно-практической конференции 22 марта 2018 г. / Коллектив авторов, 263-279p
